

Analytics
Review performance dashboards tracking conversation volume, lead conversion, and AI efficiency.
The Analytics section is a set of dashboards showing how DealerAI is performing for your dealership — how many leads came in, how many conversations the AI handled and answered, how many appointments it booked, and how Reach leads moved through the funnel.
Open it from Analytics in the sidebar. The page is titled Analytics and Leads dashboard.
Overview
Analytics data is drawn from all conversations and interactions across every connected channel.
You can combine several stores into a single report. See How to switch between dealerships for how the multi-select works.
Leads tab
The default tab, covering lead volume and where leads came from.
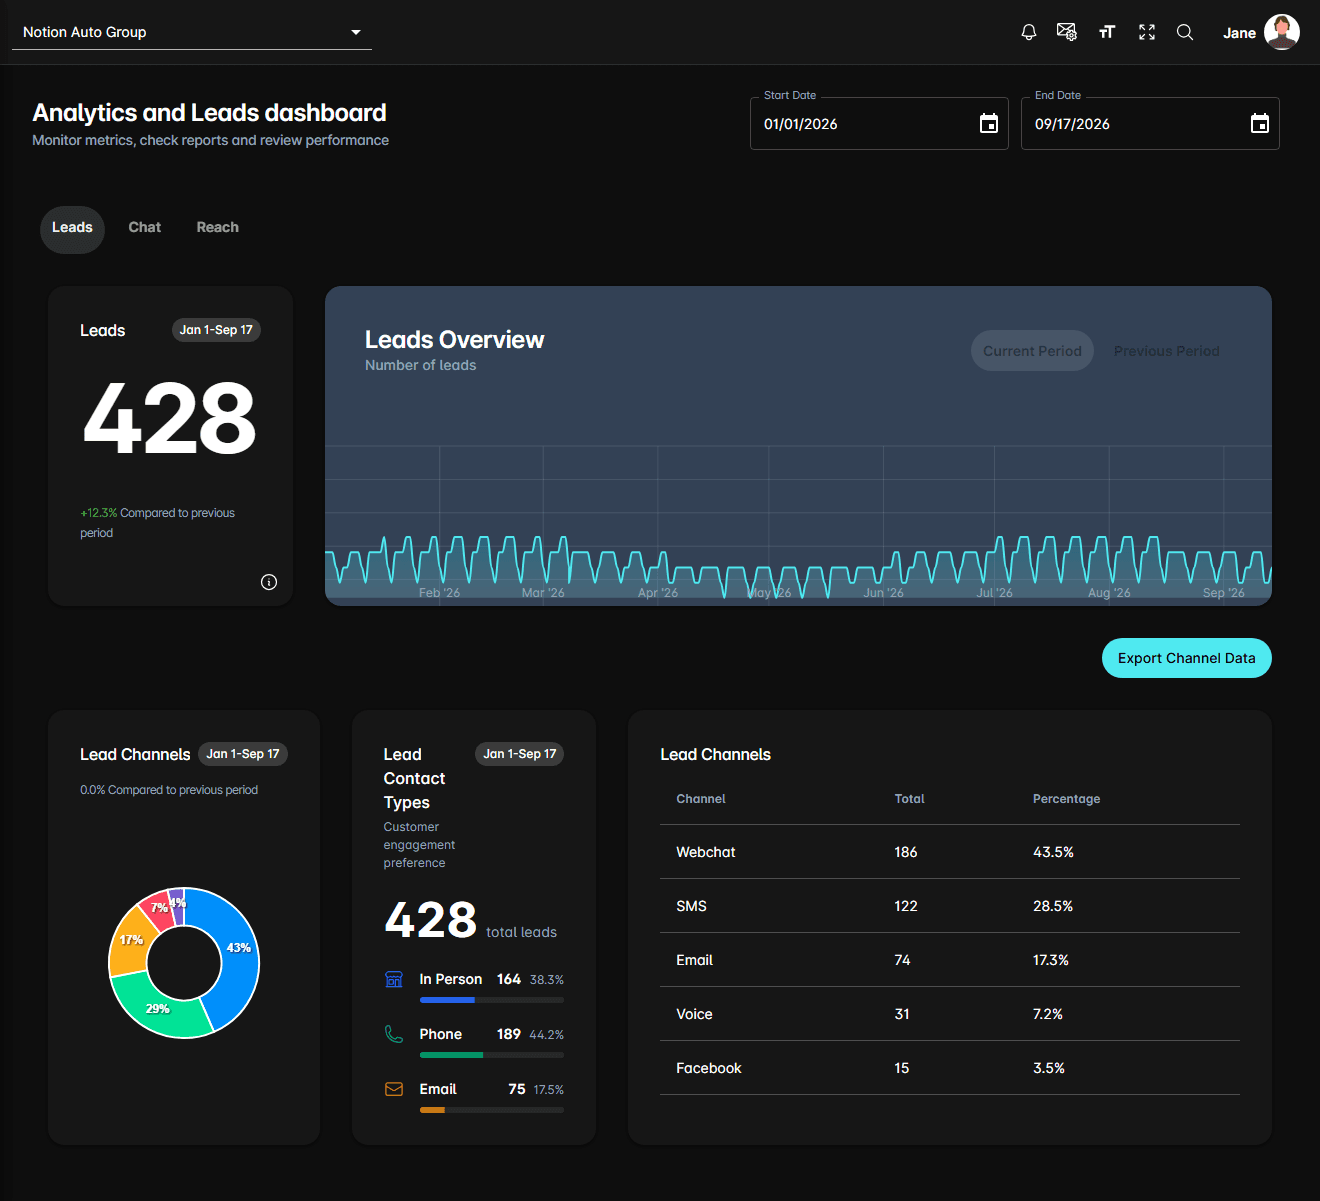
| Widget | What it shows |
|---|---|
| Leads | Total leads in the period. The ⓘ icon notes that a lead may have a phone number, an email, or both |
| Leads Overview | Area chart of leads per day, with Current Period and Previous Period tabs |
| Lead Channels | Donut plus a table of Channel, Total, and Percentage |
| Lead Contact Types | Breakdown by how the customer wants to be contacted — In Person, Phone, and Email — with counts and percentages |
Export Channel Data downloads a CSV containing the dealership, the date range, and the lead count for each channel.
Chat tab
Conversation and appointment activity.
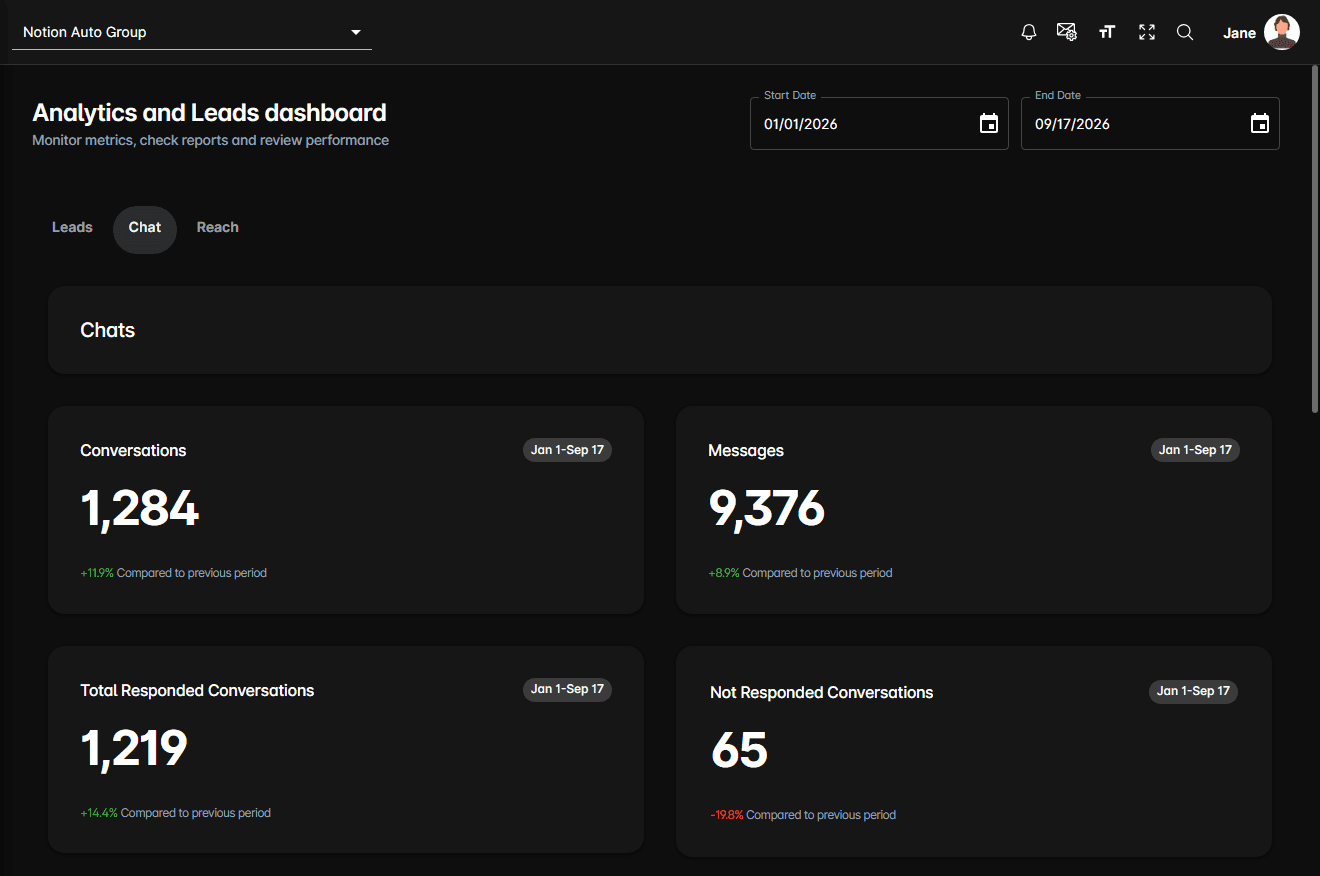
Chats
| Metric | What it counts |
|---|---|
| Conversations | Conversation threads in the period |
| Messages | Messages exchanged |
| Total Responded Conversations | Conversations that received a reply |
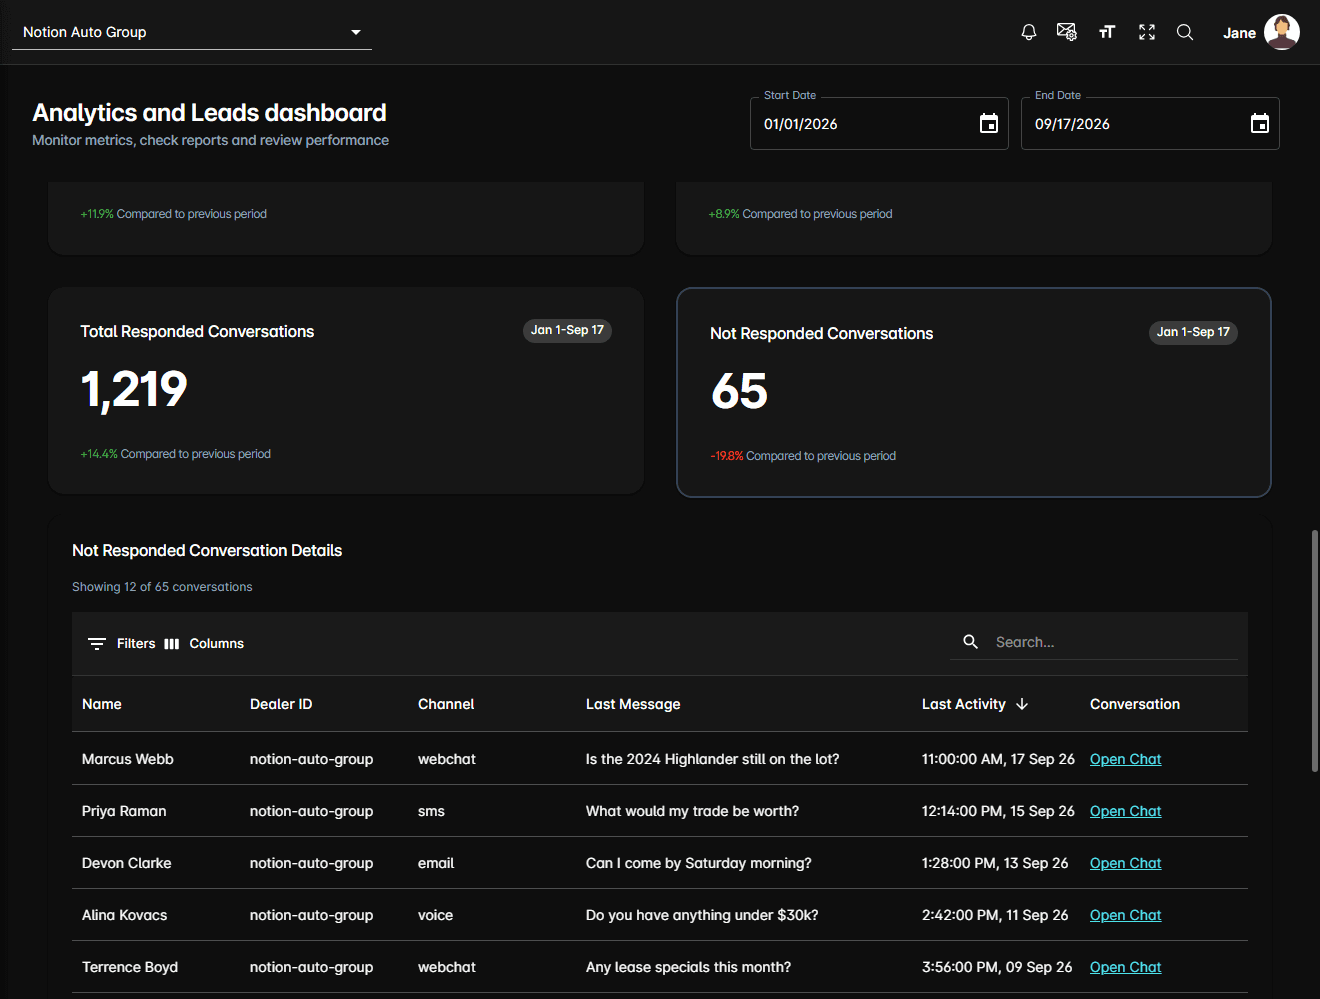
| Not Responded Conversations | Conversations that never got one |
Not Responded Conversations is clickable. Selecting it expands Not Responded Conversation Details, a table of Name, Dealer ID, Channel, Last Message, and Last Activity, with an Open Chat link on each row that takes you straight to the conversation.
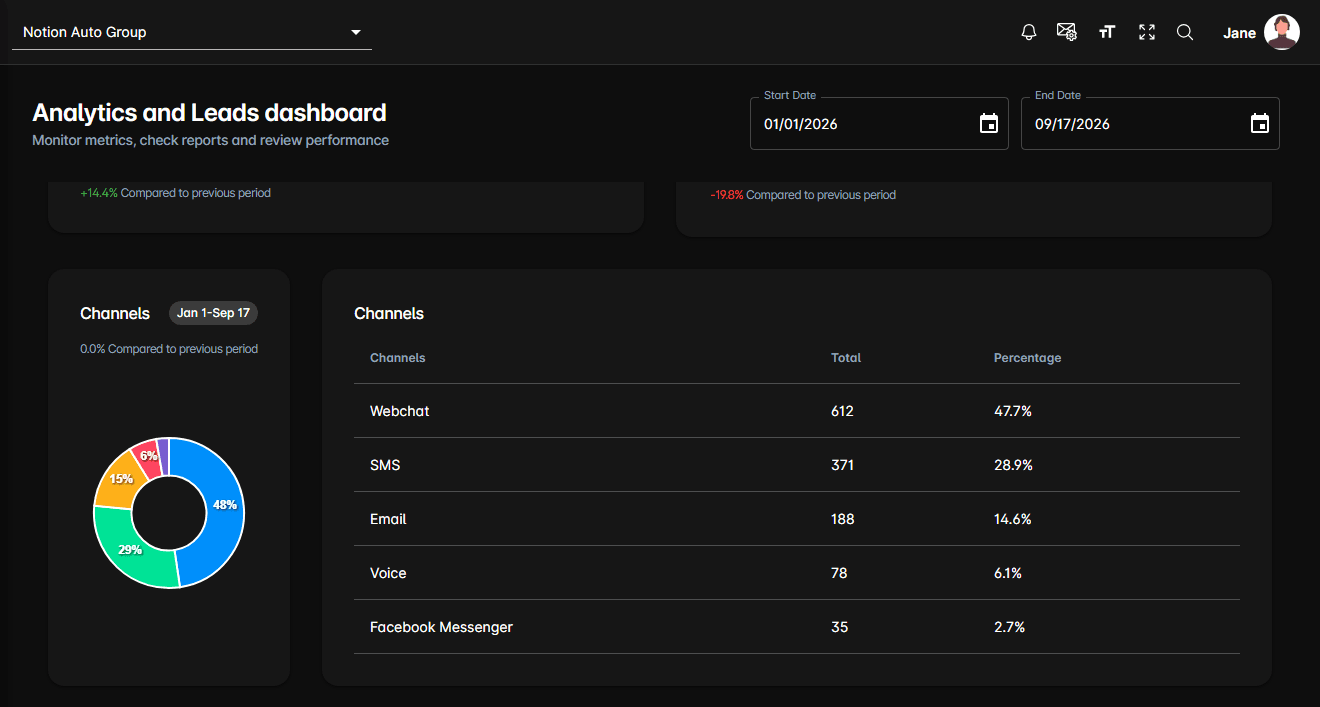
Below the numbers, a Channels donut and table break the conversations down by channel.
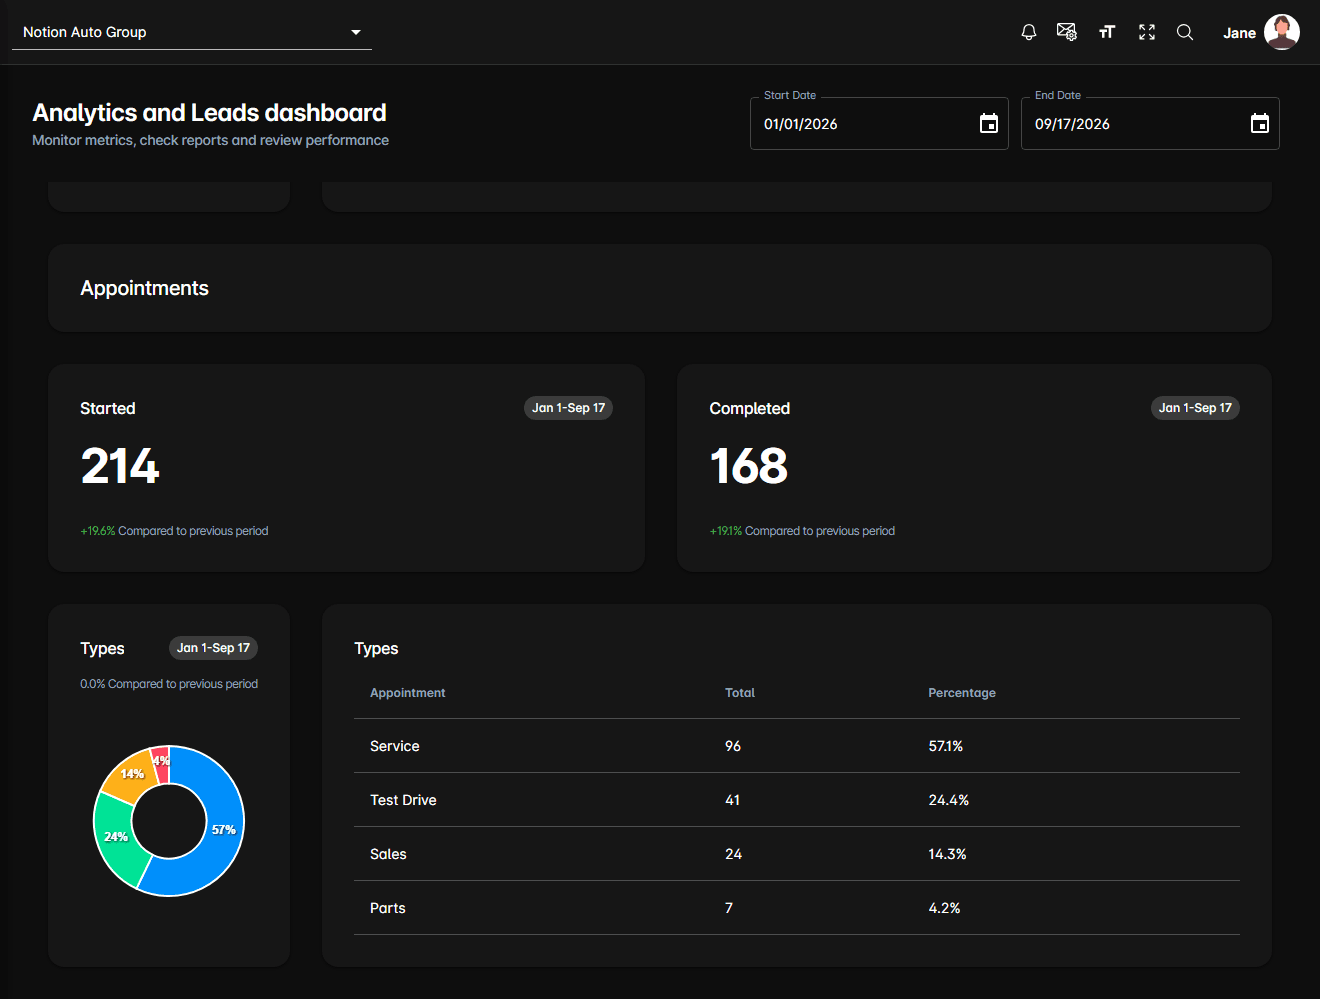
Appointments
Started and Completed counts, followed by a Types donut and table showing each appointment type as a total and a percentage.
Reach tab
Performance of your DealerAI Reach follow-up.
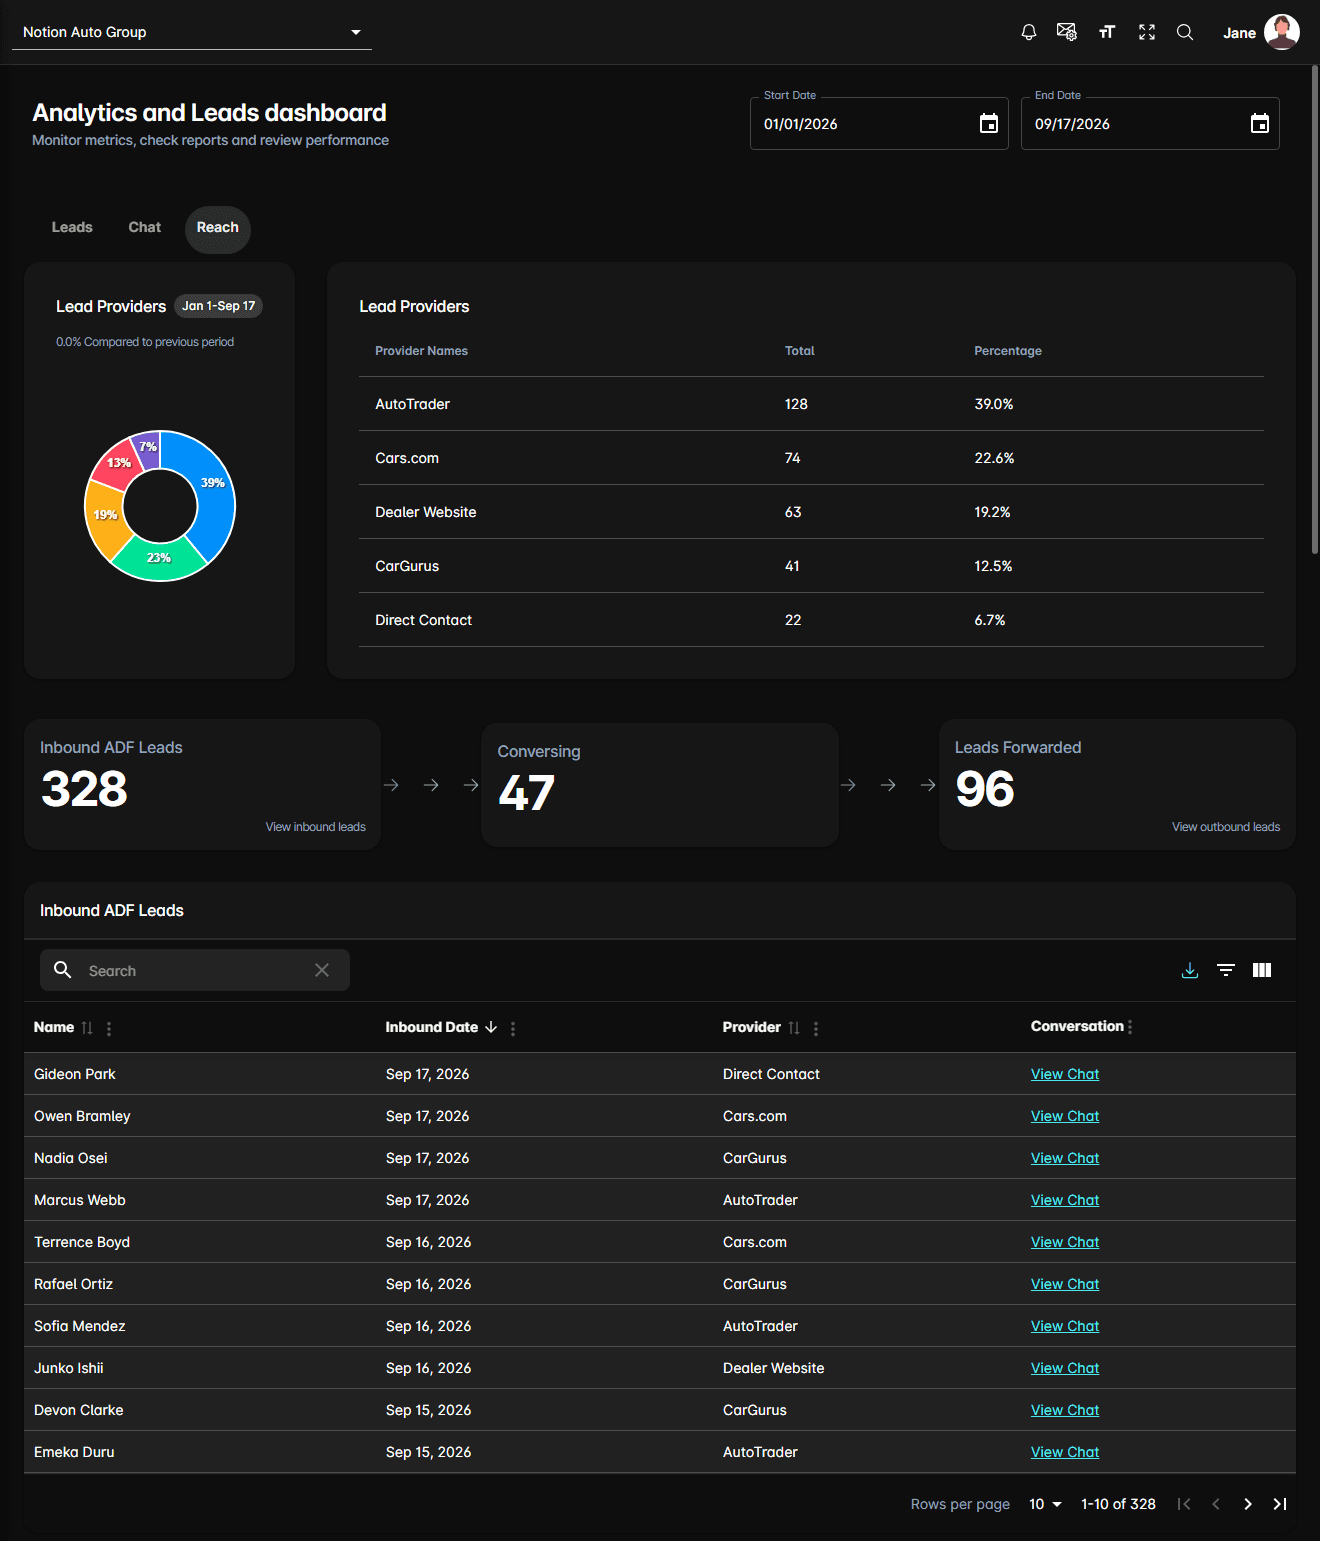
Lead Providers shows a donut and a table of Provider Names, Total, and Percentage.
Under it, three cards trace the funnel:
| Card | What it counts |
|---|---|
| Inbound ADF Leads | Leads received from your lead providers |
| Conversing | Reach conversations currently active |
| Leads Forwarded | Leads Reach sent back out to your team |
Inbound ADF Leads and Leads Forwarded are clickable and swap the table shown below them:
| Table | Columns |
|---|---|
| Inbound leads | Name, Inbound Date, Provider (shows Direct Contact when the lead came in without one), Conversation |
| Outbound leads | Name, Sent Date, Conversation |
Both tables offer search, column filters, show/hide columns, full-screen, and a download icon that exports the current rows to CSV. The View Chat link in the Conversation column opens the conversation in Chats.